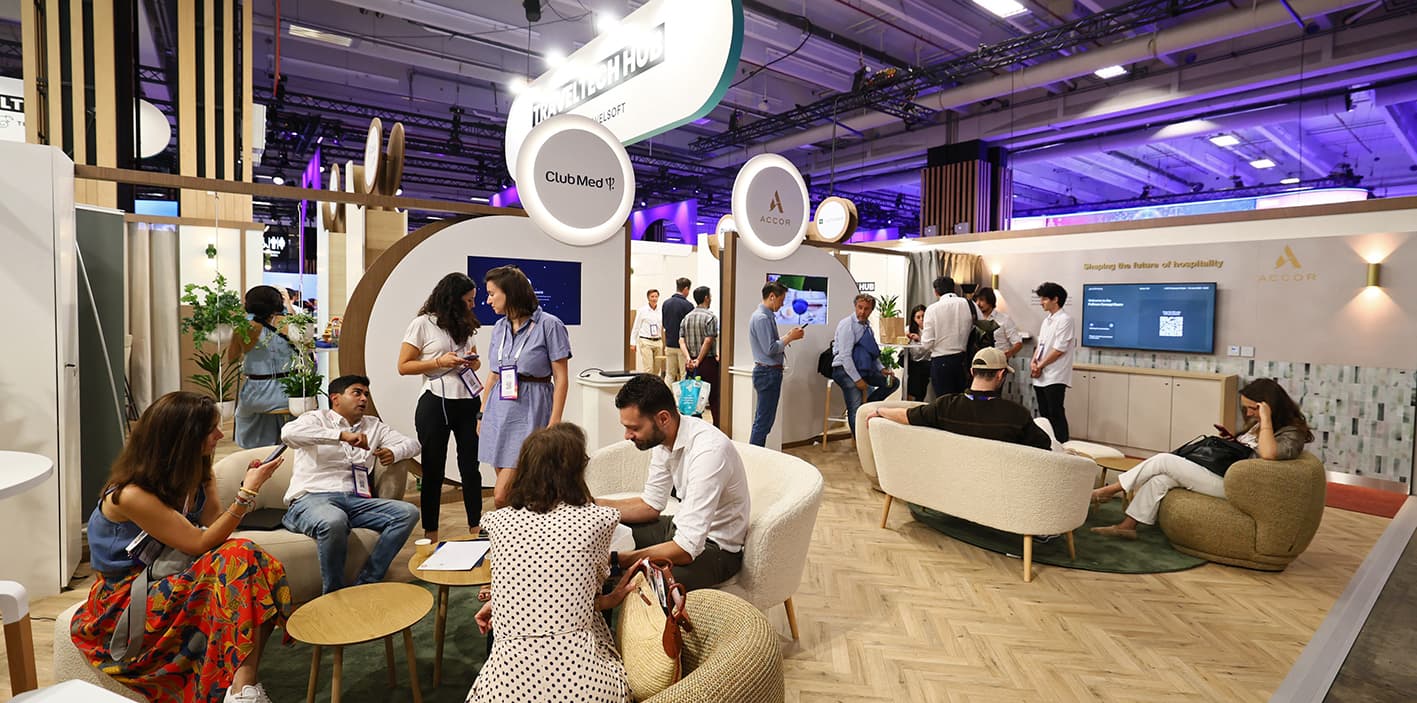
Measure the performance
of your stand.
Footfall, attention, contacts captured: what you can actually measure. For a long time, a trade show was judged by eye. Today, it leaves evidence: enough to justify this edition, and improve the next one.
A trade show is no longer judged by eye.
It is measured.
For a long time, a trade show was judged on impressions. "It was busy." "It was a good edition." Feelings, never evidence.
Today, a stand produces data. Not your revenue: that is built afterwards, in your follow-ups. But everything that precedes it can be measured: who came, where, for how long, what held their attention, and how many contacts you leave with.
Enough to improve the next edition, and justify this one.
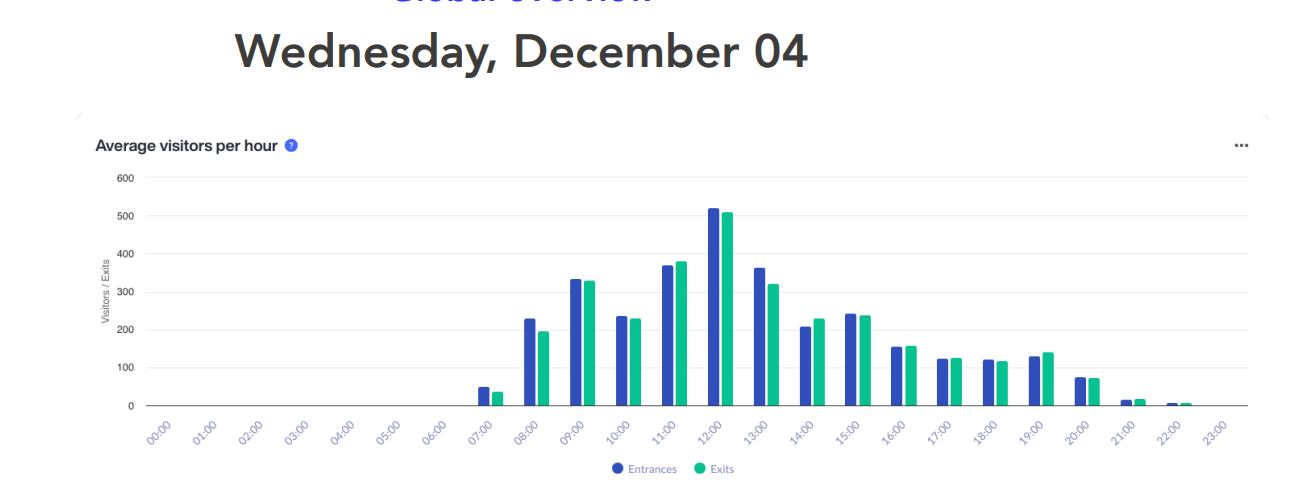
Footfall stops being a feeling.
It becomes a curve you can read.
How many visitors, on which days, at what times, with which peaks. Which routes dominate across the stand. You finally know when footfall rises, when it falls, and which moments to staff most heavily.
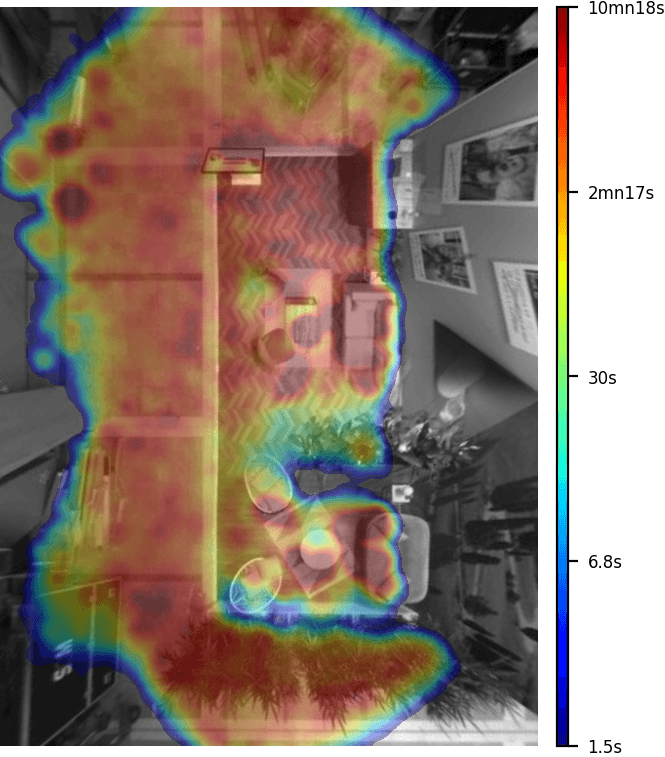
Not all areas of a stand
are created equal.
Some draw people in, hold them, spark a conversation. Others stay cold. Our heat maps reveal the hot zones, the dwell time, the blind spots: what visitors really looked at, and what they ignored.
Data is only worth something
if it answers a question.
By cross-referencing visitor flows with content, we identify what really captured attention, not what we assumed would work.
Which activation worked?
Which product generated the most interest?
Which area drove the most interaction?
Beyond footfall, the tally: how many contacts captured, which profiles, which experience triggered them. Volumes, trends, an overview of what the show delivered.
These figures do two jobs:
prove today, decide tomorrow.
Prove today
Internally, they justify the investment: a clear case showing that the show delivered.
Decide tomorrow
For the next edition, they chart the course: repeat what worked, fix what did not land.
The trade show becomes a cycle of continuous improvement, no longer an expense you renew blindly.
 Want to measure your next trade show?
Let's talk about what you would really like to know.
Before placing a single sensor, we frame the right questions: what you are trying to prove, what you want to improve. A one-hour conversation is usually enough to see whether we should move forward together.